Commodity Channel Index (CCI)
CCI is genuinely good at one thing: telling you when price has stretched unusually far from its average. That's a useful read. Where people go wrong is turning it into a mechanical system — buy the break above +100, sell below −100 — and running it blind. That's the part that disappoints. Used as a second opinion that only acts when a trend you already trust agrees, CCI quietly earns its place. Here's how to think about it, and where it helps.
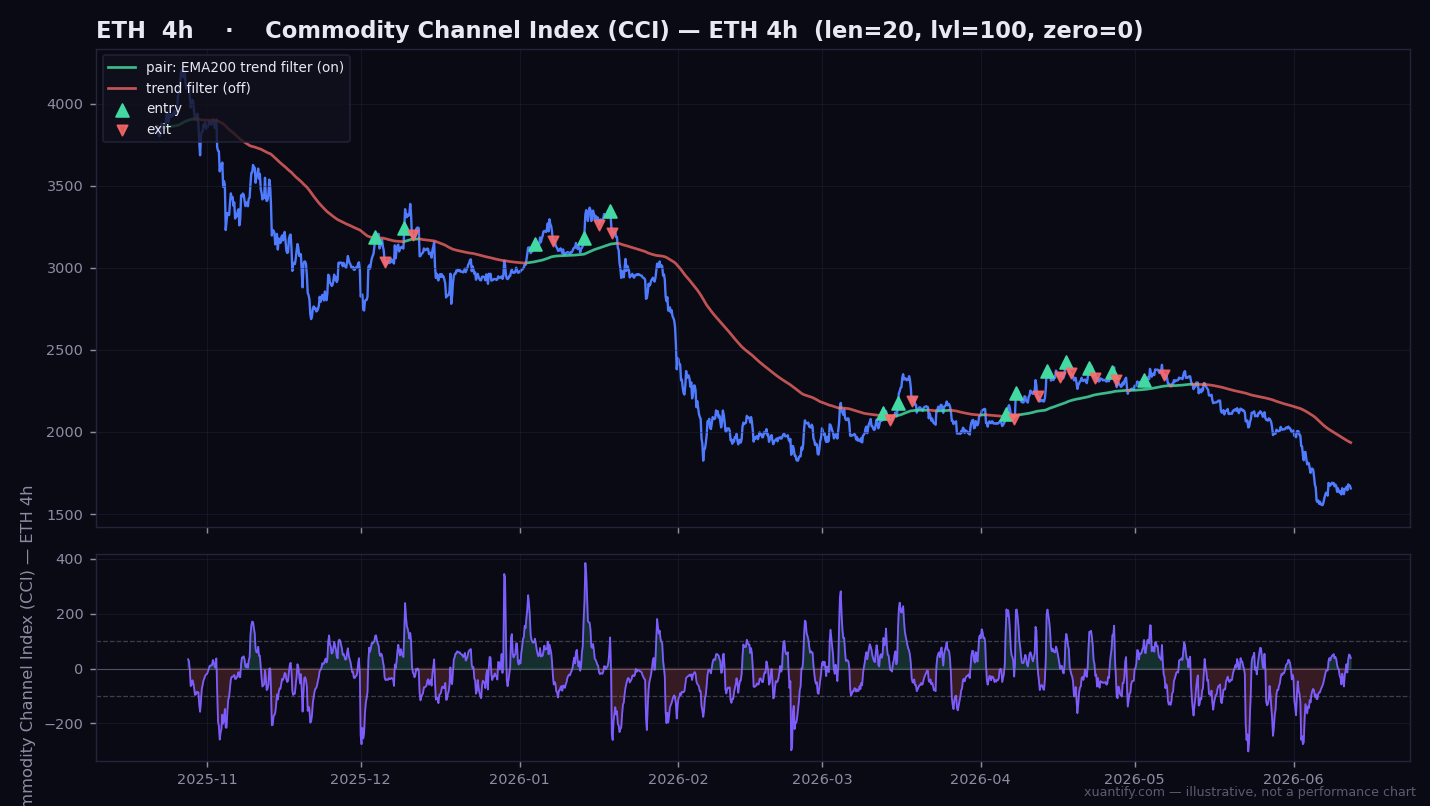
Entry · As a confirmation: only act on a setup you already like when CCI agrees that price has stretched in your direction and is turning — not on the raw ±100 cross alone.
Exit · Ease out as CCI normalises back toward zero, protected by a stop. The reading times the move; it doesn't decide the trade by itself.
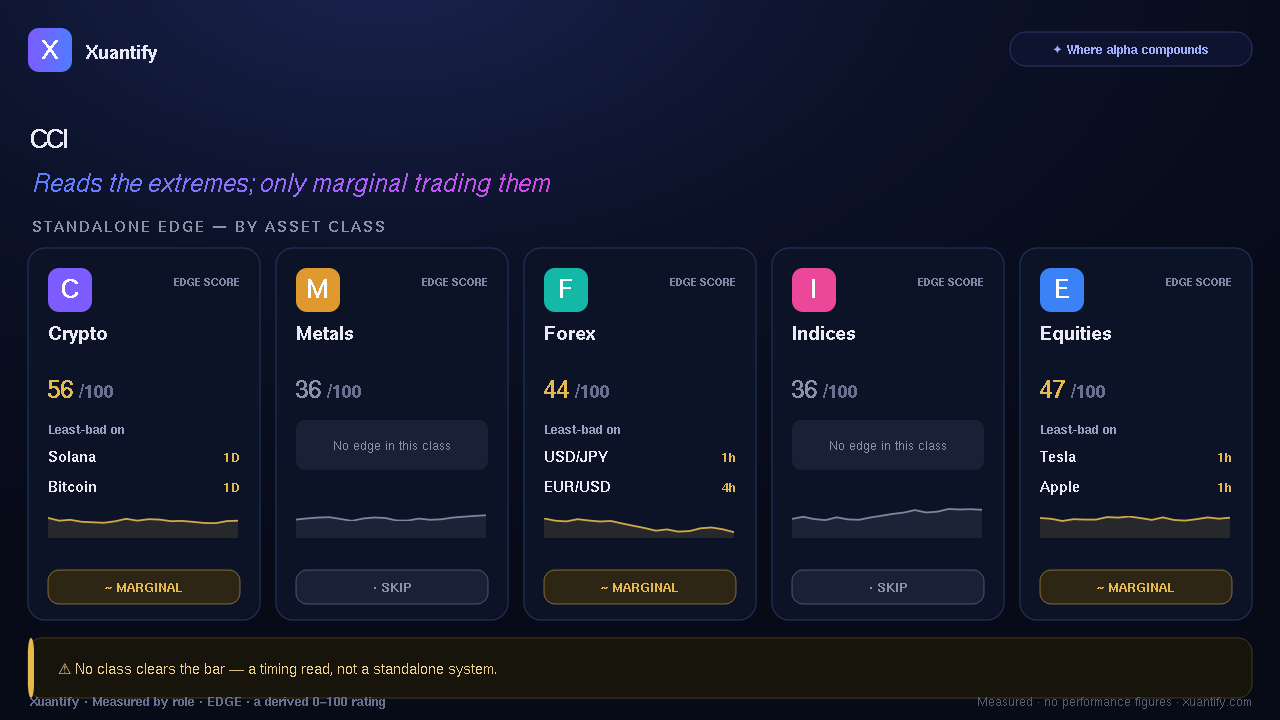
We treat CCI as a stretch gauge and confirmation layer — its most useful role — rather than the classic standalone ±100 breakout, which is where it earns nothing.
What it's really good at
CCI is a *stretch detector*: it tells you when price has run unusually far from where it normally trades. As a way to spot when a market is overheated or oversold — and to time an entry you already wanted to make — it's a genuinely sharp second pair of eyes. As a magic buy/sell button on every market, it disappoints. That's the common mistake, not a fault of the tool.
Where it shines
It does its best work as a confirmation layer inside a view you already have. If you already think a market is turning, a CCI that confirms the stretch is a far better moment to act than guessing. Used this way — to sharpen entries rather than generate them — it adds a steady, honest edge of timing.
Where to be careful
The trap is trading the ±100 breakout on its own. In a sustained trend, CCI keeps flashing 'overbought' while price marches higher — fade that and you bleed. Treat the reading as a cue that needs a trend you trust behind it, not a trigger you fire blind. Knowing when *not* to act on it is half its value.
How we test it — and why you can trust it
We don't take one good-looking backtest at face value. We test across five years of real markets, on data the tool hasn't seen, re-checked across many separate periods — because setups that dazzle in one lucky stretch quietly fall apart in others. So when we tell you where CCI earns its keep, it's because it held up across the cycle, not in a single window.