Moving Average Convergence Divergence (MACD)
MACD is one of the most popular momentum tools out there, and not for nothing — it's genuinely good at spotting when a market shifts gears. What most people miss is *where* it shines and *where* it quietly costs you. That difference is the whole game, and it's exactly what we measure. The good news: there is a real, dependable edge in here. The honest part: it's narrower than the internet implies. Here's how to think about MACD — and use it well.
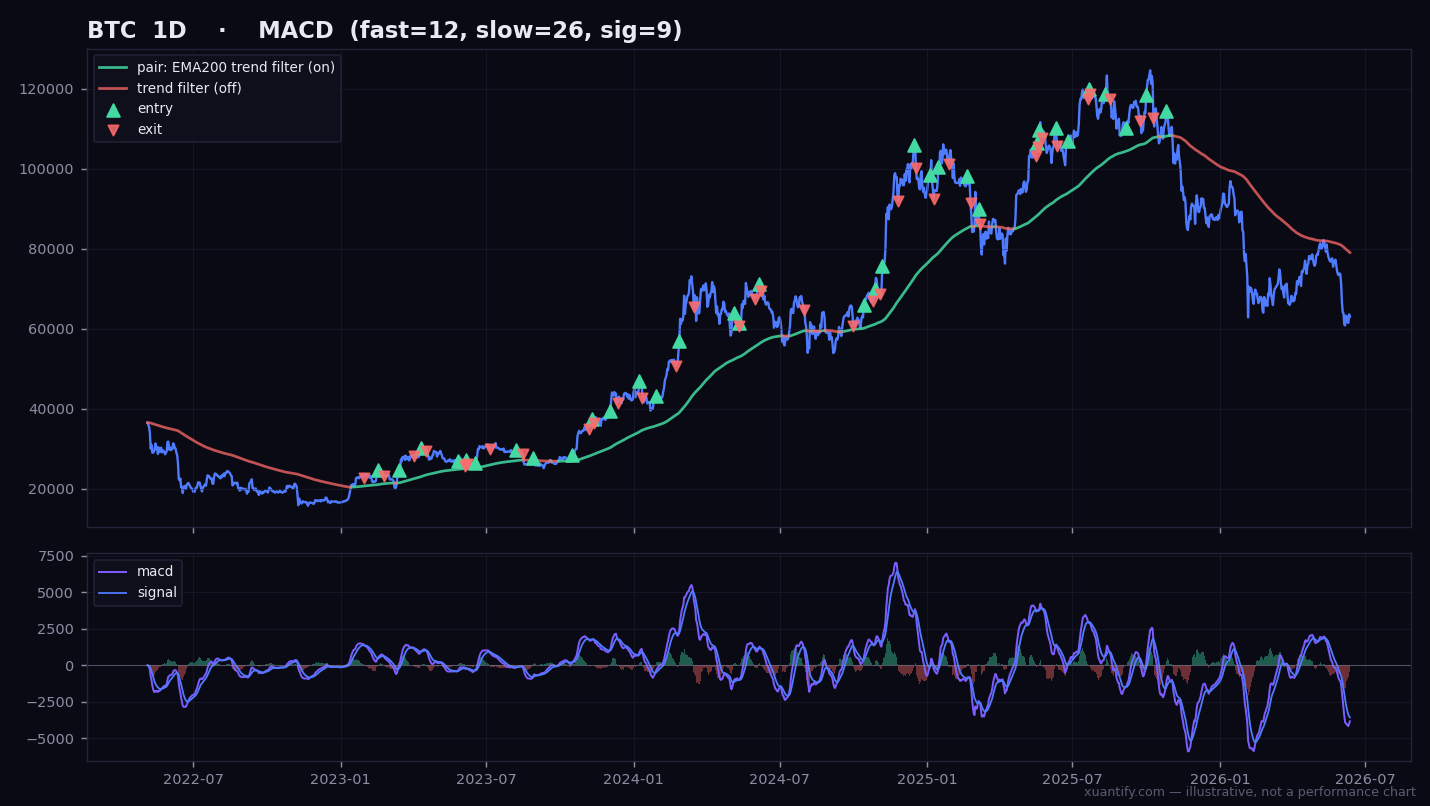
Entry · Long when the momentum line crosses above its signal line (the trend turning up); short on the mirror, a cross below.
Exit · The opposite cross closes the trade, optionally protected by a stop. No magic — it follows the momentum it measures.
We treat MACD as a momentum crossover — its classic, most common use. The point of this page is honest guidance on where that earns its keep.
What it's really good at
MACD is, at heart, a momentum reader: it tells you when a market is gathering pace in one direction. Used as a confirmation of a move that's already building, it's a genuinely helpful second pair of eyes. Used as a magic buy/sell button on every market, it disappoints — which is most people's mistake, not the tool's fault.
Where it shines
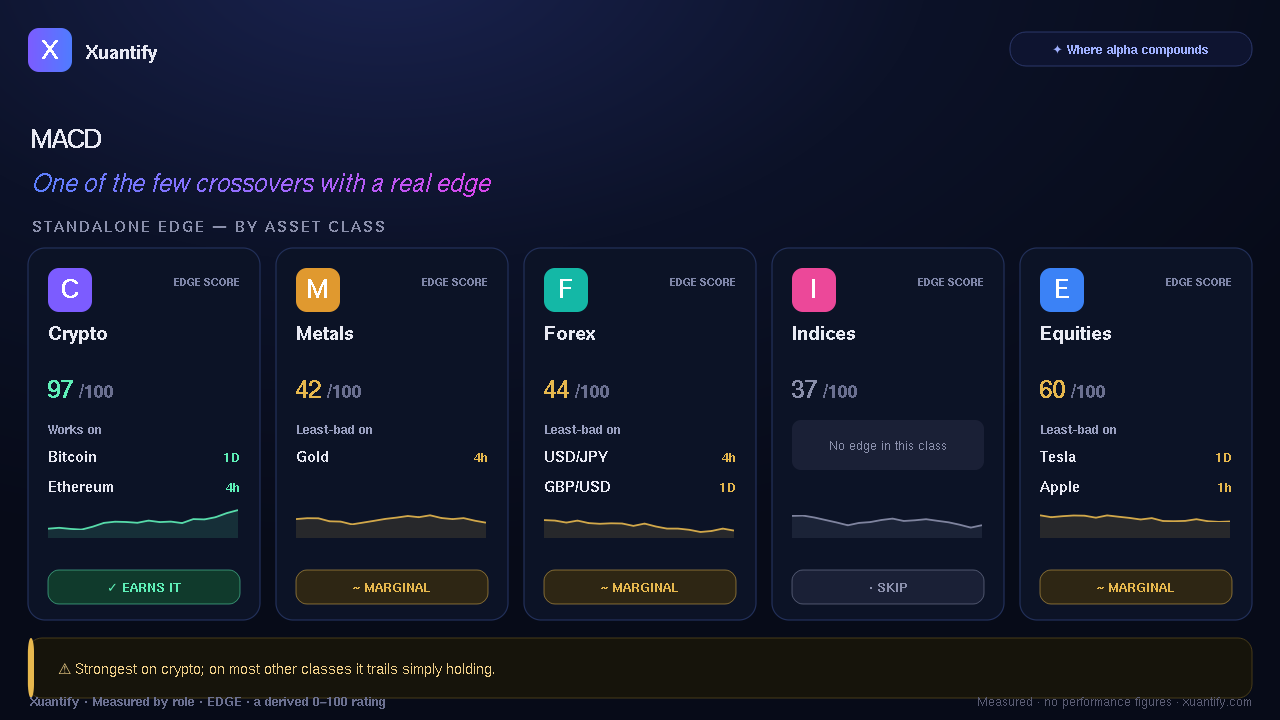
MACD does its best work on strong, trending markets — places where moves run far enough that catching the shift pays off, and where its signals line up with the direction. Crypto is its natural home: the big, decisive swings are exactly what a momentum crossover is built to ride. That's where its edge is real and repeatable.
Where to be careful
On choppy, sideways markets it gets whipsawed — in and out, paying costs each time, going nowhere. And on markets that grind relentlessly one way (think a stock that only climbs), you're usually better off simply holding than crossing in and out. Knowing to *step back* on these is as valuable as knowing when to step in.
How we test it — and why you can trust it
We don't take one good-looking backtest at face value. We test across five years of real market history, on data the tool hasn't seen, and — crucially — we re-check it across many separate time periods. A lot of setups that dazzle in one lucky stretch quietly fall apart in others; we weed those out. So when we say MACD has a verified edge somewhere, it means it kept beating simply holding across the whole cycle, not just once.