Relative Strength Index (RSI)
RSI is one of the most loved indicators out there, and there's a good reason: it's a genuinely useful read on when a market has stretched too far and is due to snap back. Where most people go wrong is treating it as a complete buy/sell *system* — buy every oversold, short every overbought — and running it blind. That's not where RSI's value lives. The good news: used the right way, RSI quietly makes your other decisions sharper. The honest part: as a standalone signal it's far less reliable than the internet implies. Here's how to think about it — and use it well.
Entry · Long when RSI crosses back up out of oversold; short on the mirror, a cross down out of overbought — the classic mean-reversion trigger.
Exit · Take profit as RSI normalises back toward the midline, protected by a stop. The trade is defined by where price reverts to, not by riding it.
We test RSI honestly as a mean-reversion trigger — traded properly, with a defined exit and a protective stop — and separately as a confirmation layer, which is where it quietly earns its keep.
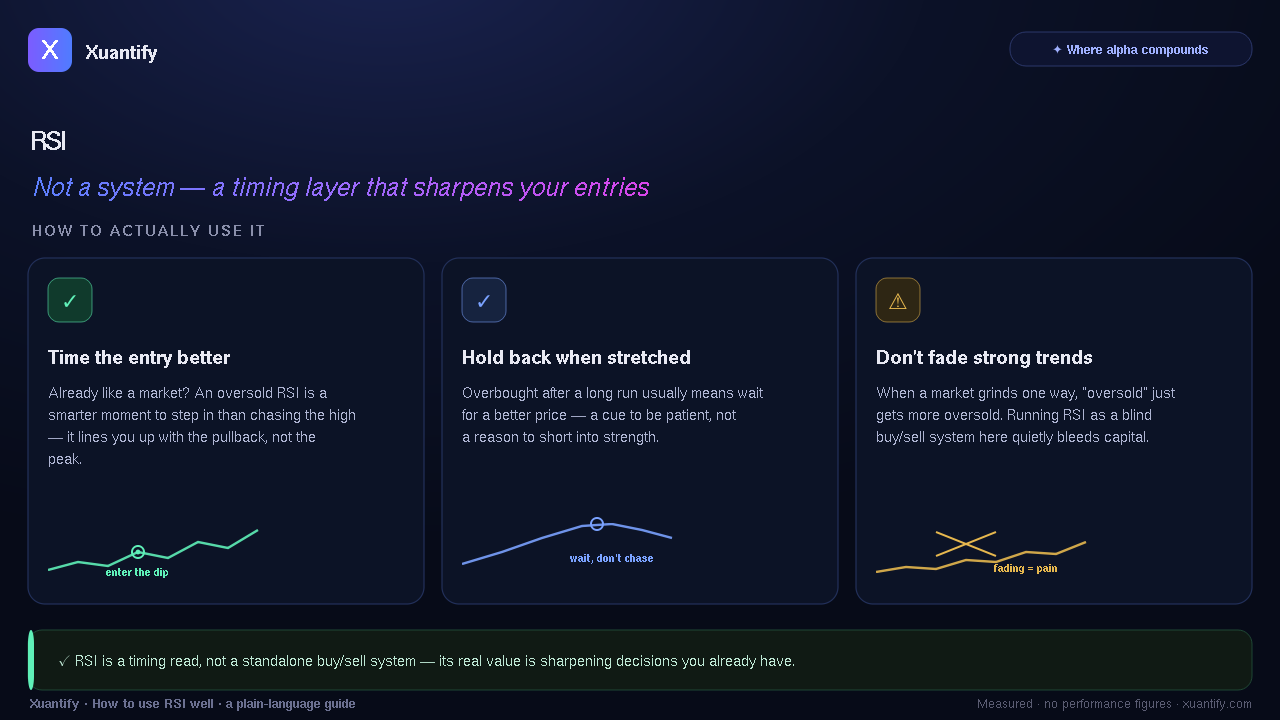
What it's really good at
RSI is a *stretch gauge*: it tells you when a market has run too far, too fast, in one direction, and is likely to ease back. As a second opinion — a way to time an entry you already wanted to make, or to hold back from chasing — it's genuinely helpful. As a magic "buy here, sell there" button you run on every market, it disappoints. That's the single most common mistake people make with it, and it's not the tool's fault.
Where it shines
RSI does its best work as a timing and confirmation layer inside a view you already have. If you already think a market is in an uptrend, an oversold RSI is a far better moment to step in than chasing a high — it lines your entry up with a pullback instead of a peak. Used this way, it consistently sharpens entries that were going to happen anyway. That's a real, repeatable contribution.
Where to be careful
The trap is running RSI as a standalone system on trending markets. When a market grinds relentlessly one way, "oversold" keeps getting more oversold, and fading it bleeds capital. The seductive part is that on the right stretch of history it can look like a clean, money-printing edge — which is exactly why honest validation matters. Knowing when *not* to fade is as valuable as the entries themselves.
How we test it — and why you can trust it
We don't take one good-looking backtest at face value. We test across five years of real market history, on data the tool hasn't seen, and — crucially — we re-check every promising setup across many separate time periods. RSI is the perfect example of why that matters: its single best-looking result dazzled in one stretch and quietly fell apart when we validated it across the whole cycle. We'd rather tell you that than sell you a lucky window.
