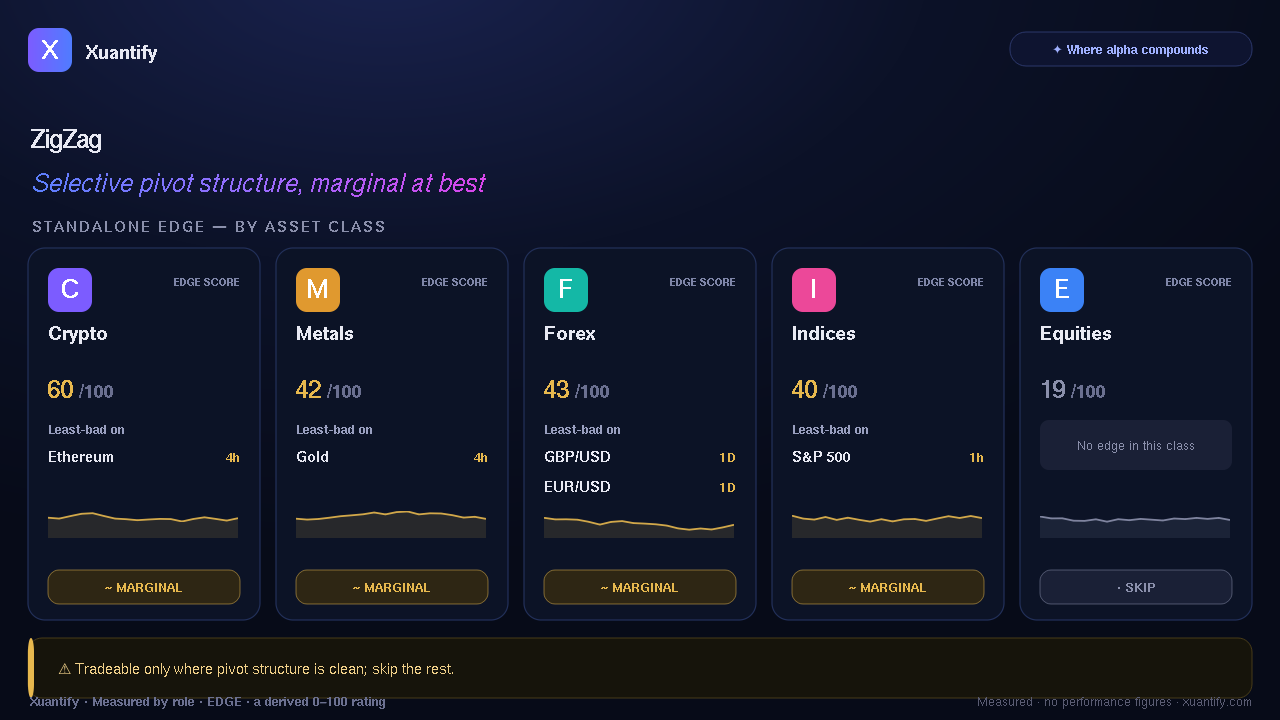
ZigZag Confluence
Pivot tools promise to call the turns. The honest version is more useful and less magical: ZigZag Confluence is genuinely good at showing you *where price has turned* and which levels matter — real structure you can build a plan around. Where it disappoints is as a buy/sell trigger: a pivot tells you a turn happened, not that the next one will hold. Used to read structure and place stops, it earns its place; used to predict reversals, it doesn't. Here's how to use it well.
Entry · As structure: use confirmed pivots and confluence levels to frame where to act and where you're wrong — inside a directional plan you already have, not as the trigger itself.
Exit · Place stops beyond the structure the pivots mark; let the level, not a fixed rule, define where the idea fails.
We treat it as a structure-and-stops tool — its real value — not as a standalone reversal trigger, which carries no edge that survives honest testing.
What it's really good at
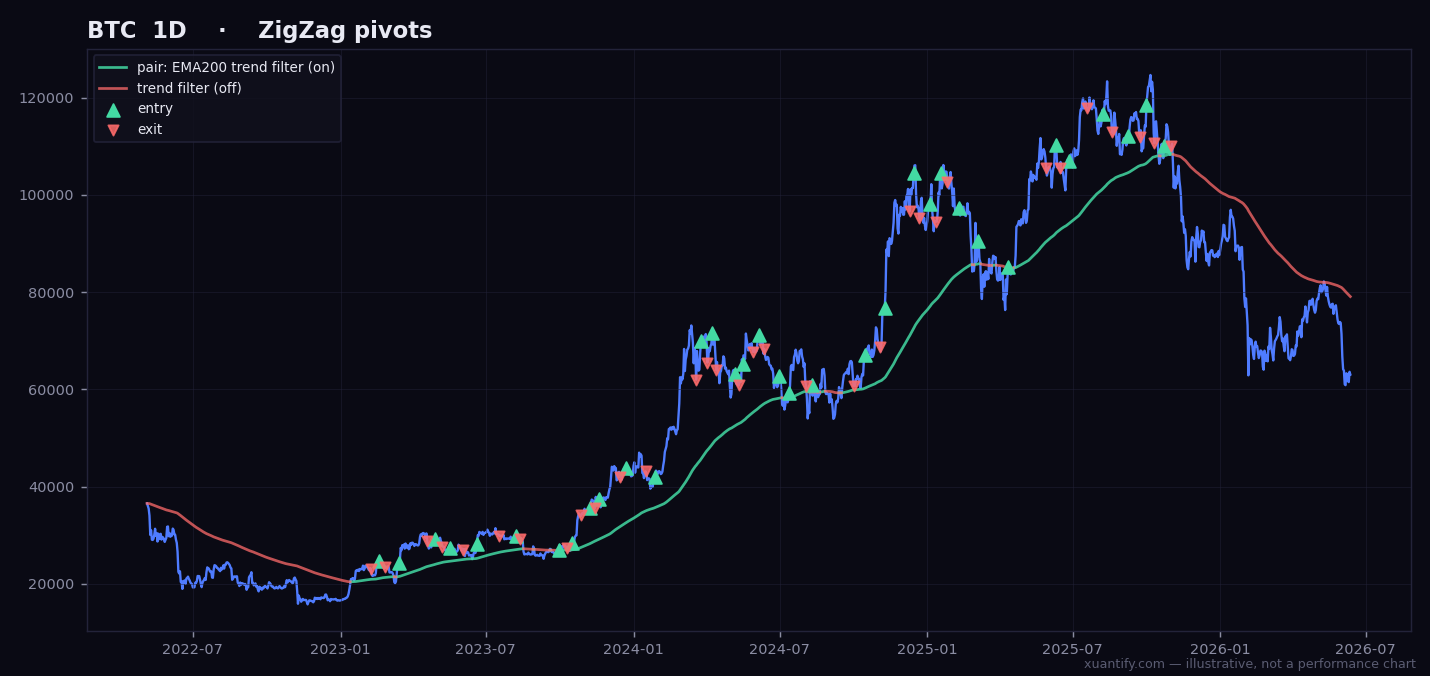
It's a *structure map*: it cleanly marks where price turned and which support and resistance levels are doing real work. That's genuinely useful — it turns a noisy chart into a readable map of where the market has respected levels before. As a way to *see* structure, it's one of the clearer tools out there.
Where it shines
Its best, most honest use is placing stops and reading levels. Pivots give you natural, structure-based places to put a stop — beyond the level the market actually respected — instead of a guessed distance. Inside a plan you already trust, that precision quietly improves your risk on every trade.
Where to be careful
The trap is treating a pivot as a prediction. The signal arrives *after* the turn, and in strong, persistent trends, fading those pivots against the trend bleeds capital. Use the structure to manage trades, not to call tops and bottoms. Knowing it's a map, not a forecast, is the whole point.
How we test it — and why you can trust it
We tested the pivots as a trading signal every honest way, across five years of real markets, on fresh data, re-checked across many separate periods. The structure is real; the standalone trade isn't. We'd rather tell you exactly what it's for than dress a drawing tool up as a system.